Python in Excel is a very powerful instrument which can be used to quickly and efficiently analyze complex datasets.
But before proceeding to examples with datasets it is important to understand some basics of how Python can work in your Excel data sheet.
Let’s consider something very simple like adding multiple numbers. In case of Python for Excel any access to the Excel table data is performed using dataframes. Even to access a single number you will need to create a dataframe with it. Creation of dataframe is very fast so there is no much concern about it unless you are creating thousands of them.
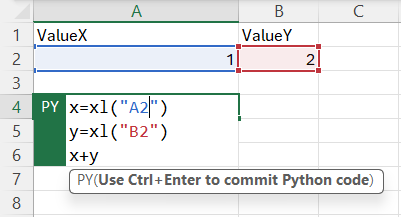
Dataframes in Python for Excel are created using xl() command. First parameter to this function is the excel data range you want to create dataframe for. For example, if you want to create dataframe with data of just a single cell, type the name of the cell as a first parameter to xl() function: xl(“A2”). If you want a range type the range like you do in any Excel formulas. What is helpful is that ranges can be created by just selecting required range in Excel sheet.
In the example below you can see two dataframes being initialized: one for A2 cell and another for B2 cell. After that dataframes x and y are added together. As you can see when there is no assignment operation Python for Excel assumes that the value is the return value of the current formula. In this example, x+y will be calculated and result of it shown in the Python for Excel cell.