Dataframe is the most important data object you will encounter when working with python in Excel. Dataframe represents a table with data. Dataframe can be created based on a data in your Excel spreadsheet or based on calculations performed by Python in Excel.
Below is an example of how you can create dataframe from data in Exceel spreadsheet.
spend=xl(“A2:A4”,headers=True)
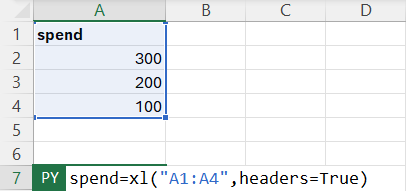
The command used to create dataframe is xl(). As a first parameter you can submit a range of Excel cells. As a second parameter you can submit options for dataframe. In this example we specified that dataframe needs to be created from range of A1:A4 and first row will contain header data.
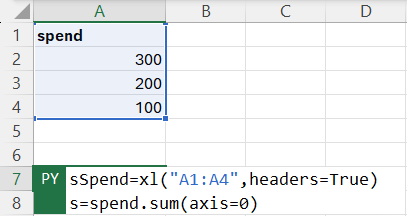
Now that we have a data frame we can do some basic manipulations with it. We will start with a simple example which aggregates values in spend column. The code for it is as follows:
spend=xl(“A1:A4”,headers=True)
s=spend.sum(axis=0)
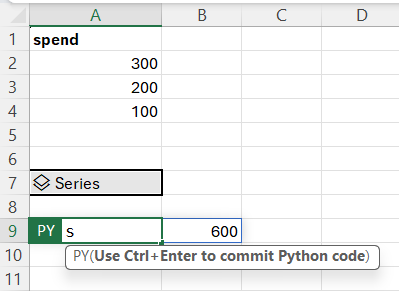
If you paste this code in the python for Excel formula you will see this cell marked as dataframe. It means that dataframe was created and is available for use.
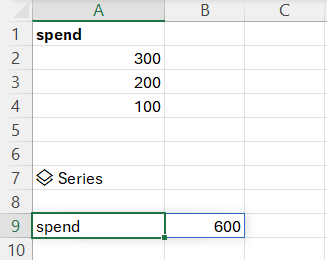
To output this dataframe just type “s” in the other python for Excel formula cell.
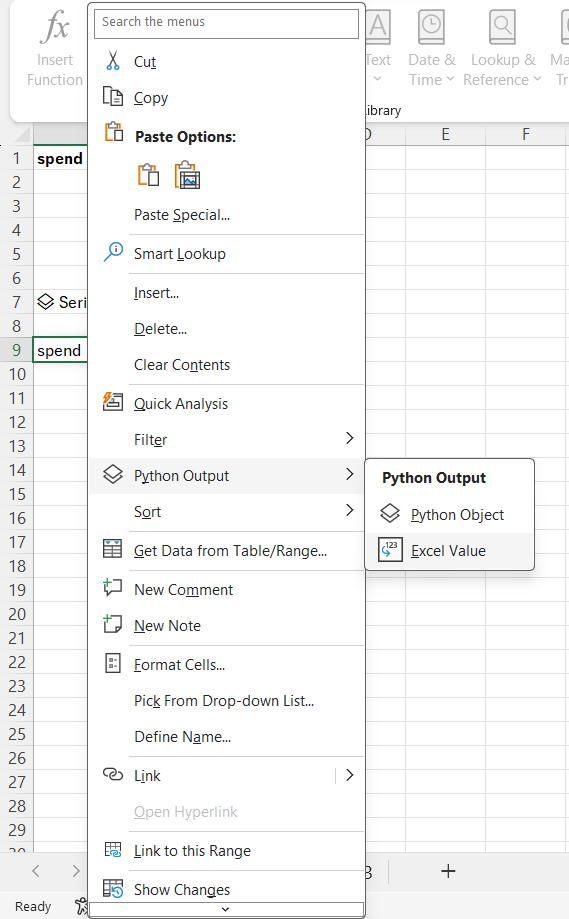
IMPORTANT: To make the data in dataframe spill over to other Excel cell select Python Output -> Excel Value in the popup menu for the python dataframe cell.
Once you change the Python Output value you will see sum of spend displayed.
Make sure to press Ctrl+Enter when completing Python in Excel formula to initiate recalculation.